/filters:quality(90)/fit-in/970x750/coros-web-faq/upload/images/dca745213a34e769dab8f5d121ec1be7.png)
The 2026 London Marathon will be remembered as the day the sport changed. Sabastian Sawe of Kenya crossed the line in 1:59:30, the first sub-two-hour marathon ever run in a sanctioned race. Behind him, Yomif Kejelcha (1:59:41) and Jacob Kiplimo (2:00:28) also ran under the previous world record. In the women's event, Ethiopia's Tigst Assefa ran 2:15:41 to set a new women's-only world record. Sharing the roads with history were thousands of COROS athletes, and their data reveals a story worth telling.
We looked at their collective data, including months of training, race-week routines, post-race recovery, and of course the marathon itself. Buried in London's results are a myriad of interesting insights. Here's what it shows.
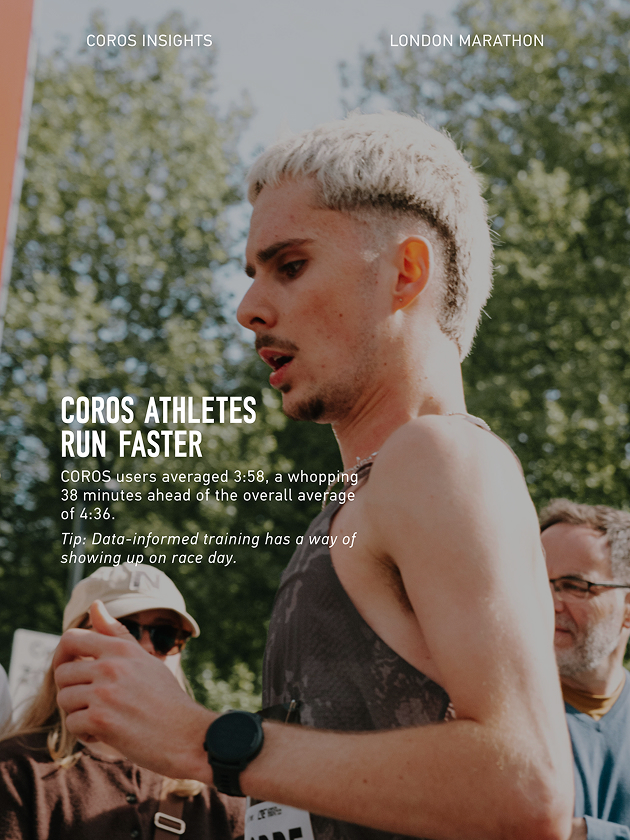
COROS Athletes Ran Fast
COROS athletes at London averaged 3:57:55, 38 minutes faster than the overall race average of 4:36:22... Miles of difference. That easily bridges the gap between an average marathon and a great one, and that's just the beginning of the story.
Data-informed training has a way of showing up on race day. If you're running without a watch, you may be leaving more time on the table than you think.
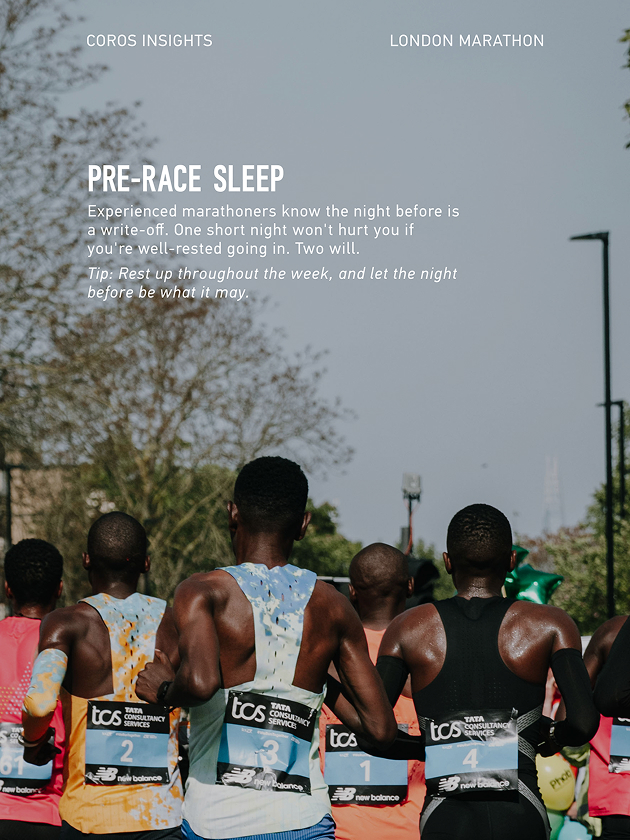
Sleep: The Night Before Tells Only Half the Story
Ask any marathon runner about the night before the race and you'll hear the same thing: they barely slept. The data confirms it.
Across every finish-time group, athletes slept less than their normal average the night before the gun. The pre-race nerves, early alarms, and unfamiliar hotel beds are a universal struggle.
The more telling pattern is two nights out: athletes slept more than their baseline across every finish-time group. Experienced marathoners know the night before is a write-off. One short night won't hurt you if you're well-rested going in. Two will.
| Finish Time | Average Sleep | Night Before | Difference | 2 Nights Before | Difference |
|---|---|---|---|---|---|
| Sub-2:30 | 7:38 | 7:07 | -31 min | 8:13 | +35 min |
| 2:30-3:00 | 7:40 | 7:22 | -18 min | 7:59 | +19 min |
| 3:00-3:30 | 7:40 | 7:13 | -27 min | 8:04 | +24 min |
| 3:30-4:00 | 7:31 | 7:14 | -17 min | 7:58 | +27 min |
| 4:00-5:00 | 7:33 | 7:25 | -8 min | 7:54 | +21 min |
| 5:00+ | 7:22 | 7:15 | -7 min | 7:40 | +18 min |
The sleep gap between the fastest and slowest finishers is worth noting too. It's not perfectly linear, but the trend is clear: more sleep generally leads to faster times. The difference is modest, but even just 10 minutes a night is over an hour a week. More than 60 hours across a year.
For athletes, sleep is training, and every minute truly counts. Sleep is when the body makes its adaptations to training, rebuilding stronger after every session. More sleep means more time to absorb the work you've already put in. Small habits, compounded.
Training Plans for Everyone
COROS offers training plans for runners targeting everything from a 5-hour finish down to breaking 3:00. Among our London athletes who fell within that range, 42% followed a COROS plan during their build. Nearly half the field training with a structured, purpose-built plan — all for free.
Browse the full training plan library, or if you want something built around your specific goals and schedule, the Personalized Training Plan in the COROS app will do exactly that.
The Fitness Numbers Behind the Finish Times
As expected, faster finishes correlated with higher VO2max, higher Base Fitness scores, and more weekly mileage. The data makes the relationship concrete.
| Finish Time | VO2max | Base Fitness | Avg Weekly Mileage (Excluding Taper) |
|---|---|---|---|
| Sub-2:30 | 66 | 119 | 64mi / 103km |
| 2:30-3:00 | 60 | 107 | 48mi / 77km |
| 3:00-3:30 | 55 | 95 | 35mi / 56km |
| 3:30-4:00 | 50 | 83 | 25mi / 40km |
| 4:00-5:00 | 46 | 74 | 20mi / 32km |
| 5:00+ | 40 | 62 | 14mi / 23km |
A couple of sub-2:30 athletes averaged over 100 miles per week across their build. On the other end, a handful of athletes crossed the line having logged virtually no training beforehand — either losing a bet or winning one, depending on how you look at it.
The Best Zone Distribution for Marathoners?
Perhaps the most interesting insight is about how the fastest athletes actually train.
Yes, faster athletes run more miles, but they run most of those extra miles easier. The top finishers spent a higher percentage of their training volume in Zone 1 compared to others.
The 80/20 rule is tossed around in endurance circles: roughly 80% of training at easy effort, 20% at harder intensities. Sub-2:30 finishers at London tracked almost exactly to that split during their build, with 83% of miles in Zones 1 and 2. In absolute terms they ran more miles in every zone (a rising tide lifts all boats), but the distribution is what sets them apart. They ran fewer of their total miles at marathon pace, not more.
The further down the finishing order you go, the more that ratio shifts. Runners in the 4:00–5:00 group were closer to 65/35, spending significantly more of their training at moderate and hard efforts relative to easy ones. It feels productive, but the data suggests it may be costing them.
The London data makes the case plainly: top-tier athletes don't beat the marathon by spending more time simulating it. They build a deeper aerobic base, then sharpen on top of it.
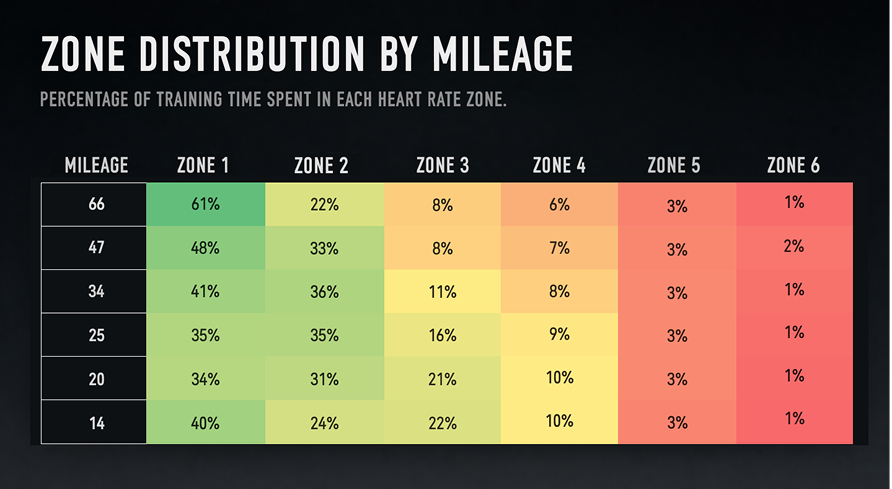
The difference is most dramatic at the top. The fastest group ran 40 miles per week in Zone 1. The 2:30–3:00 group ran 22. Nearly double the base volume to eek out those final few minutes of improvement.
Tapering: Almost Everyone Got It Right
Race week told a consistent story: athletes cut volume, protected fitness, and showed up ready.
Most athletes reduced their training by around 40% in the week leading into London. Higher-mileage runners pulled back even more, with some reaching close to 50% reductions. Two-thirds of athletes, regardless of finishing time, entered the race with a Training Status in the Performance zone. The taper message has landed, and athletes are trusting their data to guide them there.
The best athletes didn't shut down completely, though. Sub-3:00 finishers still ran 3–4 miles at marathon pace or faster during race week; fewer than in a normal training week, but enough to keep the legs sharp without accumulating fatigue.
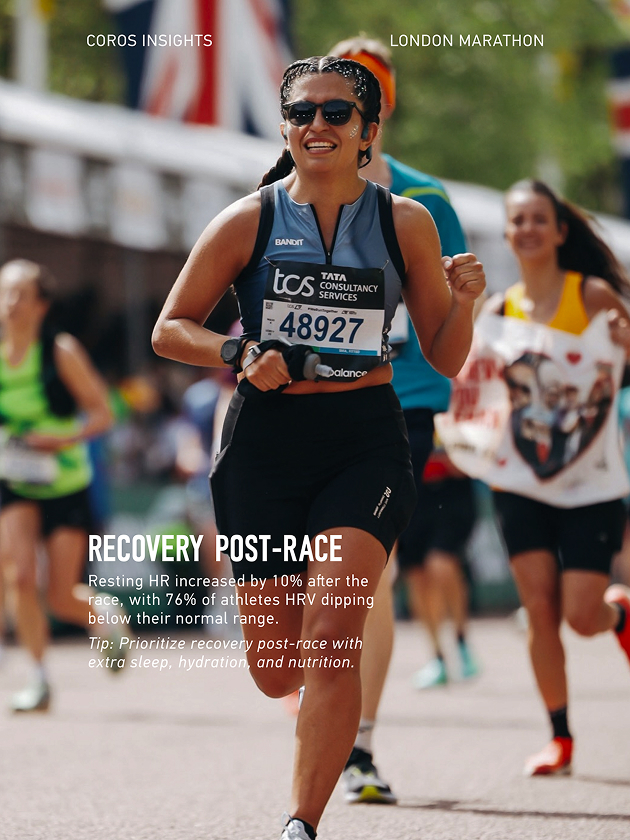
After the Finish Line: What Recovery Looks Like
The race ends at the line. Then recovery begins.
Post-race data from COROS athletes showed two clear physiological signals. Resting heart rate consistently climbed 10% after the race — a reliable marker of systemic fatigue and the body's demand for repair. Heart Rate Variability (HRV), a measure of nervous system fatigue, showed the same fatigued trend. 76% of athletes saw theirs drop below their normal range the day after London.
Together, these numbers paint an honest picture of what a marathon does to the body. The body takes a real beating over twenty-six miles. The week that follows is where adaptation and recovery actually happens — and where patience matters most.
The COROS athletes who ran London this year shared in a historic race, shared an achievement, and shared a host of data patterns. Trends were most evident in the fastest runners, but they held across finish times. Marathon running is a long game. The data from London is one more reason to play it that way.
Data sourced from a large dataset of COROS athletes who competed in the 2026 London Marathon. All data is anonymized and analyzed in aggregate.